
Dire Predictions About the Effects of AHCA’s Per Capita Allocations Find No Support in the CMS Data
by Doug Badger
The American Health Care Act (AHCA) would establish per capita Medicaid allocation levels, beginning in 2020,[i] as part of changes to give states more flexibility and incentives to improve care delivery and cost-effectiveness in their Medicaid programs that now cover an estimated 72 million Americans. Although some have suggested that the allocation levels would produce large reductions in federal Medicaid spending, a comparison of projected per capita Medicaid spending under AHCA with baseline projections prepared by the Centers for Medicare and Medicaid Services (CMS) suggests that these limits would achieve virtually no federal Medicaid savings.[ii]
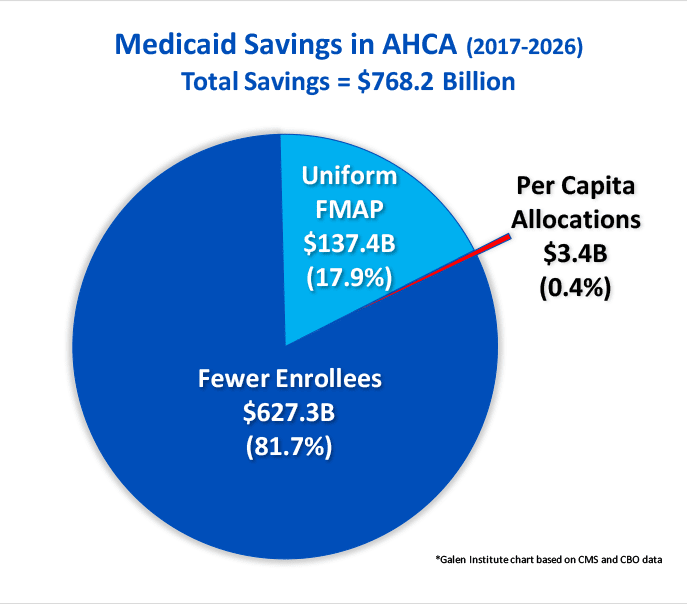 As the figure above illustrates, other AHCA provisions would substantially reduce federal Medicaid spending. First, AHCA would require the federal government to provide the same percentage of matching funds for every eligibility category. Under the Affordable Care Act’s Medicaid expansion, the federal government provides preferential financial payments on behalf of nondisabled, non-aged, non-pregnant adults. It currently pays 95 percent of the medical costs incurred by recipients in this Medicaid eligibility category, compared with an average of 58 percent for other eligibility groups (aged, disabled, children, pregnant women).[iii] The federal match for these expansion adults would phase down to 90 percent in 2020 and remain there in perpetuity.
AHCA would equalize the federal Medicaid matching rate (FMAP) across all eligibility categories, beginning January 2020. This lower matching rate for nondisabled, non-aged, non-pregnant adults would achieve an estimated $137.4 billion in federal savings between 2020 and 2026.
Second, according to CBO, providing equitable federal matching payments across all eligibility categories will result in fewer states covering expansion adults. The Supreme Court held in NFIB v. Sebelius that the federal government lacks constitutional authority to compel states to expand their Medicaid program to include expansion adults.[iv] As of June 2017, 19 states had declined to expand their programs. CBO theorizes that providing the same level of federal matching funds for expansion adults as for other categories of Medicaid recipients will result in more states declining to cover this population. There would consequently be several million fewer people on Medicaid than under current CBO projections.[v]
Third, CBO supposes that millions of people who would continue to be eligible for Medicaid either would refuse to enroll or drop out of the program due to AHCA’s repeal of the tax penalty on the uninsured. AHCA’s standardization of FMAP and repeal of the individual mandate are largely responsible for CBO’s opinion that the number of Medicaid recipients will ultimately decline by 14 million, compared with their current law projections. Multiplying these CBO enrollment declines by CMS’s projected per capita Medicaid spending would result in an estimated $768.2 billion in federal savings between 2018 and 2026. Of those savings:
- 7 percent ($627.3 billion) are attributable to the CBO assumption that Medicaid enrollment would be substantially smaller under AHCA than under current law
- 9 percent ($137.4 billion) are due to the reduced FMAP for the expansion population
- 4 percent ($3.4 billion) would derive from AHCA’s establishment of federal per capita allocations.
Basis for Estimates
These estimates are based on data published by CMS in its most recent 2016 actuarial report.[vi] The report includes several data elements on which this study is based. These include:
- Projected per capita medical assistance payments for each of the five Medicaid eligibility categories.[vii]
- Projected number of recipients by eligibility category.[viii]
- Projected state and federal Medicaid expenditures.[ix]
- Projected medical inflation.[x]
To estimate federal savings, this report combines these CMS baseline assumptions with CBO estimates of enrollment reductions that it believes would result from enactment of AHCA.[xi] The following sections provide further detail on three sources of savings: 1) savings due to reduction in Medicaid enrollment; 2) savings due to normalization of FMAP; and 3) savings due to per capita allocations.
Savings Due to Reductions in Medicaid Enrollment
CBO theorizes that the number of Medicaid recipients would be substantially smaller under AHCA than under its current law estimates. Those effects, as noted above, would be substantial.
- CBO believes 6 million fewer people will be covered under Medicaid prior to 2020 because AHCA repeals the tax on the uninsured. CBO says that this enrollment effect “would continue throughout the 2017-2026 period.”[xii] It thus accounts for nearly half of the Medicaid attrition.
- CBO believes 5 million fewer people who live in one of the 19 states that have not expanded their Medicaid programs would be enrolled in the program if AHCA were to become law. If Congress does not enact AHCA, CBO believes that some states (it neither knows nor specifies which) would expand their programs, adding 5 million adults to the Medicaid rolls. CBO includes these 5 million recipients in its current law baseline. Under AHCA, CBO believes that none of those 19 states will ever cover expansion adults under their programs, resulting in 5 million fewer Medicaid recipients. [xiii]
- CBO also believes that some of the 31 states that have expanded Medicaid would reverse that expansion, were AHCA enacted. Again, CBO neither knows nor specifies which of the 31 states would take such action. Although CBO does not assign a specific coverage number to this facet of its estimate, it does assert that the percentage of the population living in expansion states will drop from 50 percent to 30 percent by 2024.[xiv]
The table below shows the reduction in the number of Medicaid enrollees projected by CBO.[xv]
| Table 1. CBO Estimates of Medicaid Enrollment Reductions Under AHCA | |||||||||
| 2018 | 2019 | 2020 | 2021 | 2022 | 2023 | 2024 | 2025 | 2026 | |
| Estimated reduction | -4.0 | -6.0 | -9.0 | -12.0 | -13.0 | -13.0 | -14.0 | -14.0 | -14.0 |
Multiplying the CBO enrollment reductions by the federal share of average enrollee spending for each year yields a total of $627.3 billion in federal Medicaid savings. It is worth noting that savings from enrollment reductions also accrue to states. The fewer people a state has on its Medicaid rolls, the less it spends on Medicaid. Because the federal government provides matching funds for state Medicaid spending, it shares in these savings.
Savings Due To Normalization of FMAP
This system of federal matching payments leads to a second source of federal Medicaid savings under AHCA. The rate of these federal payments—known as the Federal Medical Assistance Percentage (FMAP)—varies by state. The federal government pays half the medical assistance costs of states with the highest per capita incomes (FMAP = 50 percent). The FMAP is higher for states with lower per capita incomes. In 2017, Mississippi claims the highest FMAP (74.63 percent).
The ACA altered this arrangement. It establishes an FMAP for expansion adults ranging from 90 to 100 percent, as shown in the table below.
| Table 2. FMAP for Expansion Adults Under ACA | |
| Calendar Year | FMAP |
| 2014-2016 | 100 percent |
| 2017 | 95 percent |
| 2018 | 94 percent |
| 2019 | 93 percent |
| 2020 and thereafter | 90 percent |
The FMAP formula for expansion adults marks a sharp departure from longstanding Medicaid policy in two important ways. First, it distinguishes between eligibility categories, providing a much higher rate of federal reimbursement for expansion adults than for every other category of recipients.
Second, this higher rate is paid without regard to a state’s per capita income. Medicaid reimbursement has long been premised on the notion that states with low per capita incomes are likely to have a greater proportion of low-income people and fewer public resources to finance their medical care. As a result, they receive greater support from the federal government in the form of a higher FMAP.
The ACA disrupted this arrangement. Affluent states like Connecticut (median household income: $72,889) recover 95 percent of the costs of providing medical services to nondisabled, non-aged, non-pregnant adults. Mississippi (median household income: $40,037), on the other hand, claims an FMAP of less than 75 percent of the costs it bears for providing medical care to people with developmental disabilities.
AHCA would conform federal Medicaid reimbursement to its original intent. The FMAP for expansion adults who enroll on or after January 1, 2020, will be the same as for all other categories of Medicaid recipients in a state. To take the example above, Connecticut could still claim a 95 percent FMAP for an expansion adult who enrolls prior to January 2020. The FMAP would revert to Connecticut’s standard amount (50 percent) for an expansion adult who enrolls after that date.
Over time, those who signed up for Medicaid prior to 2019 would transition off the rolls. CBO believes that, by 2021, two-thirds of Medicaid recipients who were enrolled as of December 2019 will have left the rolls.[xvi] By 2024, that will have fallen to 5 percent.[xvii] Once the transition is complete, the FMAP would be the same for all categories of eligible recipients within a state. The result would be that the federal government would pay a smaller share of overall Medicaid expenses beginning in 2020, resulting in a $137.4 billion reduction in federal spending between 2020 and 2026.
Savings Due To Per Capita Allocations
AHCA bases per capita allocations on 2016 expenditures by eligibility group.[xviii] These figures are adjusted by medical inflation for each eligibility group through 2019. Beginning in 2020, per capita medical assistance allocations for the elderly and disabled are adjusted by medical inflation plus one percent. Per capita allocations for the remaining eligibility categories continue to be adjusted for medical inflation. Table 1 summarizes these adjustments.
| Table 3. Inflation Adjustments to Per Capita Allotments Under AHCA | ||
| Eligibility Category | 2017-2019 Adjustment | Adjustment beginning 2020 |
| Elderly | CPI-U (medical) | CPI-U (medical)+1 percentage point |
| People with disabilities | CPI-U (medical) | CPI-U (medical)+1 percentage point |
| Children | CPI-U (medical) | CPI-U (medical) |
| Non-expansion adults | CPI-U (medical) | CPI-U (medical) |
| Expansion adults | CPI-U (medical) | CPI-U (medical) |
AHCA establishes Medicaid per capita allocation totals, beginning in 2020. Those allocations are based on the average per capita assistance in 2016, updated for medical inflation. Below is a table comparing per capita medical assistance under AHCA with the CMS baseline projections, for 2020 through 2026.
| Table 4. Medicaid Per Capita Allocations Under AHCA Compared With CMS Baseline | |||||||
| Per capita spending | 2020 | 2021 | 2022 | 2023 | 2024 | 2025 | 2026 |
| CMS baseline | $8,889 | $9,327 | $9,802 | $10,312 | $10,853 | $11,433 | $12,078 |
| AHCA | $8,966 | $9,397 | $9,862 | $10,351 | $10,862 | $11,406 | $12,016 |
| Exceed AHCA Allocation? | NO | NO | NO | NO | NO | YES | YES |
Using CMS baseline assumptions, per capita Medicaid spending would exceed the allocation levels established under AHCA only in 2025 and 2026. The bill would require the federal government to recover its share of spending above those allocation levels. That would result in a reduction of $3.44 billion in federal Medicaid spending over that period.
These savings are small relative to other Medicaid provisions in AHCA for several reasons. First, CMS projects the rate of medical inflation to average a bit more than 4.2 percent between 2018 and 2025. Since the AHCA per capita growth rate is pegged to medical inflation, the per capita allocations would rise at a rate that is quite similar to the CMS baseline rate. Second, CMS assumes Medicaid per capita growth rates to be less than the growth of medical inflation from 2016 to 2018. The AHCA per capita caps would thus grow more quickly than the CMS baseline through this period. Third, CMS forecasts that the rate of Medicaid per capita spending would outpace medical inflation beginning in 2019. This would ultimately lead to projected per capita costs eclipsing the rate of growth in the AHCA caps beginning in 2025, albeit by a relatively small amount.
Aggregate Medicaid spending would exceed the caps by an estimated $5.9 billion over those two years. The federal government would recover 58 percent (the FMAP for those years) of this amount. The resulting $3.44 billion in federal savings between 2020 and 2026 represents 0.16 percent of the estimated $2.22 trillion in federal Medicaid spending over that period.[xix]
Aggregate Savings
Table 5 shows aggregate Medicaid savings under AHCA.
| Table 5. Estimated Federal Medicaid Savings Under AHCA, 2017-2026 | |||||||||||
| AHCA Savings | 2017 | 2018 | 2019 | 2020 | 2021 | 2022 | 2023 | 2024 | 2025 | 2026 | Total |
| Total | $0 | $20.0 | $31.5 | $51.4 | $80.0 | $95.6 | $102.9 | $117.5 | $128.0 | $141.3 | $768.2 |
| -Fewer Recipients | $0 | $20.0 | $31.5 | $49.3 | $69.0 | $78.5 | $82.6 | $93.6 | $98.6 | $104.2 | $627.3 |
| -Uniform FMAP | $0 | $0 | $0 | $2.1 | $11.0 | $17.1 | $20.3 | $23.9 | $28.3 | $34.7 | $137.4 |
| -Capitated allocations | $0 | $0 | $0 | $0 | $0 | $0 | $0 | $0 | $1.0 | $2.4 | $3.4 |
The total is less than CBO’s estimate of $834 billion for a variety of reasons. First, the figures are computed based on CMS assumptions. These differ from CBO’s in several ways. CMS, for example, foresees a higher rate of medical inflation over the next decade. While CBO has not disclosed its assumptions about future medical price growth, if has offered a hint suggesting that it would average 3.7 percent annually.[xx] That Is a lower rate than CMS expects, a difference that would affect savings from AHCA’s per capita allocation regime.
A second difference involves the opacity of CBO assumptions. While CBO discloses some of the assumptions that are embedded in its baselines and in its analyses of legislation, the agency conceals important features of its models and methods. Its forecast of future Medicaid enrollment by eligibility category, for example, does not distinguish between expansion and non-expansion adults. The ACA’s federal reimbursement structure, as we have seen, skews heavily in favor of the former category. The reasons behind some of the differences in estimates are thus more difficult to pinpoint.
Third, CBO does not provide much detail about the characteristics of those it expects will lose Medicaid coverage due to AHCA. We know, for example, that nearly half will simply choose to drop out of Medicaid or never sign up at all, once the tax penalty on the uninsured is removed. But we don’t know how many are expansion adults and how many would have been eligible under criteria that antedated the ACA.
We know CBO believes that 5 million people live in states that have not yet expanded their Medicaid programs but that, in the agency’s mind at least, someday will. Some or most of those 5 million hypothetical people presumably are expansion adults. But CBO also recognizes a “woodworking effect” associated with Medicaid expansion—people who were eligible for Medicaid even under earlier standards “come out of the woodwork” to sign up for the program once a state expands eligibility. If a state were to stop covering expansion adults, there would presumably be a “reverse woodworking effect”—that is, people who might otherwise enroll will fail to do so when they learn that their state has narrowed its eligibility criteria. That 5 million figure probably comprises expansion and non-expansion adults, children, the elderly, and people with disabilities in some unknown proportion. As with food labeling, CBO discloses ingredients, but not its recipe.
CBO also shrouds information about the “interactive effects” among AHCA’s provisions, beyond disclosing that they play a crucial role in its analysis. These assumptions remain buried in opaque models and therefore are immune from scrutiny. The theories that underlie these models are no doubt reasonable, but they are impenetrable. Without piercing the veil, it is impossible to evaluate those theories or to test alternatives.[xxi]
The approach taken in this study, consequently, has limitations. It cannot be applied directly to the CBO estimates because too many of CBO’s assumptions lie beneath the surface. It nevertheless offers a reliable outline of the sources of AHCA’s Medicaid savings.
The vast majority of those savings certainly arise from CBO’s belief that millions fewer people will be enrolled in Medicaid under the AHCA than under their current law assumptions. The federal and state governments spend no Medicaid money on an individual who is not enrolled in the program. Savings due to an equitable FMAP and to per capita allocations are at the margins. It costs the federal government less to insure a nondisabled, childless adult at 58 percent FMAP than at a 90 percent FMAP, but it still costs something.
Similarly, if the medical costs of providing Medicaid in a state exceed the AHCA limits, the federal government will recover a portion of its spending, but it still will have spent a considerable amount of money. Using CMS projections of per capita spending and medical inflation, these savings will be incremental. And while CBO has declined to attach a savings estimate to AHCA’s per capita allocation provision, it is likely that the number is small.[xxii]
Discussion and Policy Implications
Others who have looked at the AHCA per capita allocations have suggested that they could have a larger effect on Medicaid spending. A Kaiser Family Foundation study, for example, found that federal Medicaid spending would have been 7 percent lower in 2001-2011 had AHCA caps been in place.[xxiii] A Brookings study also using retrospective data concluded that if the AHCA allocations been instituted in 2004, federal Medicaid spending would have been $17.8 billion lower in 2011.[xxiv]
Retrospective studies have some value in that they are based on data, rather than on projections. In particular, they are useful in showing that changes in federal reimbursement policies have disparate impacts on states. But they have limited value in forecasting what will happen in the future. The Brookings piece nicely summarizes both the value and limitations of applying the study’s conclusions to AHCA:
“It is important to note that this analysis is not a forecast of how a per capita cap would affect state Medicaid programs in the future since future spending trends will differ from those observed over this historical period. This exercise nevertheless provides important insights into the range of potential impacts and how those impacts are likely to vary across states.”
It is also worth noting that the Medicaid program has changed substantially since the previous decade. It is much larger, covers many more people, and includes a category of recipients that in earlier years were covered only in certain states, only under federal waivers, and only at the standard FMAP. The federal government has simplified Medicaid enrollment and allowed health care providers to sign people up at the point of service. In addition, the federal government provides generous subsidies for private insurance coverage, particularly to those with incomes between 100 and 200 percent of the federal poverty level. It also levies tax penalties on people who fail to enroll in coverage. And it has spent substantial sums of money promoting Medicaid and exchange-based enrollment. All of these changes exert direct and indirect effects on the Medicaid program, effects for which retrospective studies cannot account.
While policymakers can draw important lessons from retrospective studies, it is far more valuable to assess the effects of AHCA on how Medicaid will work in the future. In that context, it appears that the per capita allocations would have a small to negligible effect on federal Medicaid spending. CBO’s belief that there would be millions fewer Medicaid recipients under AHCA than under current law would have a far greater impact. Normalizing the FMAP also would produce direct savings and, according to CBO, also would have an indirect effect on projected Medicaid enrollment.
A prospective study by the Urban Institute suggests that savings from the per capita allocations in the American Health Care Act would be small relative to other Medicaid savings in the measure.[xxv] They estimate that growing per capita allocations by medical inflation would result in $51 billion over the ten-year period beginning in 2019. This would represent only about 11 percent of federal savings over that period, according to the study.
There are a number of reasons why those figures are higher than those found in this study. Most importantly, it assumes no enrollment reductions. As we have seen, applying CBO’s assumptions about enrollment reductions has a profound effect on estimated savings. Eliminating that assumption entirely would result in greater savings attributable to the caps. A second important difference lies in the fiscal window used in the Urban study. It extends through 2028. These additional two years would result in the per capita allocations producing somewhat greater savings. Third, the Urban study analyzed an earlier version of AHCA. The House-passed version increases the inflation adjustment to CPI-U medical+1 percentage point for recipients who are elderly or who have disabilities. The Urban study assumes that CPI-U medical would be used for all eligibility categories, resulting in somewhat lower allocations and, as a consequence, greater spending reductions than under the House-passed version of AHCA. Fourth, the Urban study assumes medical inflation to grow at 3.7 percent, which is below the CMS estimate of 4.2 percent used in this study. That difference spread over ten years and a larger population would also result in their study attributing greater federal spending reductions to per capita allocations. Fifth, it finds that using 2016 as a base year for computing per capita allocations would result in fairly large reductions in spending over the period. Our analysis of the CMS baseline shows that using 2016 as the base year results in per capita allocations that are higher than the CMS baseline per capita estimates in 2020. The difference appears to be arise from disparities between CMS and CBO estimates of per capita baseline spending, especially for expansion adults, and differences in estimated rates of medical inflation.
These differences in data and methodology aside, the Urban study is broadly consistent with this study’s finding that per capita allotments account for a relatively small percentage of the AHCA Medicaid savings. Our estimate of savings from per capita allotments would be larger were we to discard CBO’s assumptions about abrupt declines in Medicaid enrollment. That would be an odd assumption to toss aside, however, since it is the cornerstone of CBO’s analysis of AHCA. The fiscal effects of that presumed decline in Medicaid enrollment are far and away the largest source of AHCA’s estimated Medicaid savings.
CBO may be — and probably is – wrong in its Medicaid enrollment projections. But it is important to appreciate just how important those projections are in its estimates of AHCA’s Medicaid savings.
Conclusion
Lawmakers should be wary of accepting CBO’s estimates of the fiscal effects of AHCA’s Medicaid provisions at face value. These estimates largely depend on the agency’s belief that millions fewer people will have Medicaid coverage over the next decade, compared with current law projections. That belief rests on the assumption that AHCA would induce far-ranging political effects among Governors and state legislators and large behavioral effects among low-income people.[xxvi]
It is difficult to know how low-income people who generally owe no federal income taxes and who likely are non-filers will respond to a repeal of the tax on the uninsured. CBO may be correct in postulating that 6 million fewer of them will enroll in Medicaid as a result of that repeal. If they are wrong, AHCA will achieve considerably less federal savings than CMS has estimated.
It is similarly impossible to know whether (and which) states that might otherwise expand Medicaid would not do so if AHCA were passed. Nor can reliable estimates be made about which (if any) expansion states might choose to contract their programs in response to AHCA’s normalization of the FMAP.
Should AHCA not have the profound effects on Medicaid enrollment that CBO foresees, it will produce much smaller federal Medicaid savings. Normalizing the FMAP will continue to have fiscal effects, but neither that provision nor the AHCA caps would offset the lost savings.
The dire effects that some have ascribed to normalizing the FMAP and limiting federal Medicaid spending through per capita allocations find no support in the CMS data. It is far more likely that they would produce very little federal Medicaid savings, far less than CBO estimates. Those savings depend a good deal more on CBO’s theory about AHCA’s enrollment effects than on federal reimbursement rates and per capita allocations.
Doug Badger is a Senior Fellow at the Galen Institute and previously served as a senior White House and Senate advisor.
Appendix
June 15, 2017
Comparison of the Galen Study Findings
with the June 2017 CMS Analysis of AHCA
Shortly after the release of this Galen Institute study in June 2017, the CMS Office of the Actuary published its analysis of the American Health Care Act (AHCA).[xxvii] The CMS report is broadly consistent with the findings of the Galen study.
Specifically, the report shows that the vast majority of AHCA’s federal Medicaid savings are attributable to a presumed decline in Medicaid enrollment against baseline projections. The per capita allotments account for a far smaller share of federal savings. The CMS report also is consistent with the Galen study’s conclusion that AHCA’s baseline per capita allocations for all enrollees is higher than CMS baseline estimates throughout most of the period (2020-2026). CMS attributes greater savings to those allotments than does the Galen study because CMS used state-by-state data that are not publicly available.
1. The CMS analysis confirms the Galen finding that the estimated reduction in the number of Medicaid recipients – not the per capita allocations – accounts for the vast majority of projected federal savings under AHCA.
The Galen Institute study used data from the CMS 2016 Medicaid Actuarial Report and a CBO estimate that 14 million fewer people would be enrolled in Medicaid if AHCA were enacted. Applying the CBO enrollment estimate to CMS data, the report concluded that AHCA would produce $768.2 billion in federal Medicaid savings between 2017 and 2026, 81.7 percent of which would derive from CBO’s estimate of AHCA’s Medicaid enrollment effects.
CMS, however, estimates that net Medicaid enrollment reductions would be 8 million, most of which would be among expansion adults. This smaller enrollment effect led CMS to estimate federal Medicaid savings at $383 billion, 54 percent less than CBO’s $834 billion in estimated savings. The differences in enrollment forecasts accounts for virtually all of the $451 billion difference between the CMS and CBO estimates.
In addition, CMS attributes most of the $383 billion in federal savings to a “drop in enrollment associated with the repeal of the Medicaid expansion.”[xxviii] The remainder, CMS says, “is primarily due to the per-enrollee caps on spending.”[xxix]
2. The CMS analysis also confirms the Galen finding that the AHCA per capita allocation levels are higher than CMS baseline per capita estimates at the national level.
CMS projects that the per capita allocations for all enrollees under AHCA would be higher than its baseline projections for every year except 2026. This is very close to the Galen analysis, which forecasts that the AHCA caps would be exceeded only in 2025 and 2026, using data from the 2016 actuarial report.
| CMS June 2017 Comparison of Per Capita Medicaid Spending For All Enrollees
(Current Law Baseline vs. AHCA)[xxx] |
|||
| Year | Average Per Capita Current Law | Average Per Capita
AHCA |
AHCA Caps Exceeded? |
| 2018 | $8,443 | $8,515 | NO |
| 2019 | $8,797 | $8,834 | NO |
| 2020 | $9,179 | $9,434 | NO |
| 2021 | $9,592 | $9,834 | NO |
| 2022 | $10,033 | $10,287 | NO |
| 2023 | $10,509 | $10,723 | NO |
| 2024 | $11,022 | $11,212 | NO |
| 2025 | $11,627 | $11,717 | NO |
| 2026 | $12,265 | $12,179 | YES |
This result is quite similar to the Galen study’s finding that average per capita Medicaid spending for all enrollees would exceed the AHCA per capita allocation amounts only in 2025 and 2026. The Galen study multiplied the per capita savings for each year by the number of enrollees (assuming CBO’s estimate that there would be 14 million fewer recipients in each of those years). It concluded that Medicaid savings would total $5.9 billion, $3.4 billion of which would accrue to the federal government.
Applying the CMS enrollment estimates to the Galen study would increase total Medicaid savings to $7.2 billion over the two years, $4.2 billion of which would accrue to the federal government.
3. CMS estimates higher savings from the AHCA per capita allocations because it relies on state-by-state data that are not publicly available.
CMS forecasts that AHCA’s per capita allocations will reduce federal Medicaid spending by $64.9 billion between 2020 and 2026. That represents federal savings of less than 2.9 percent against projected federal spending of $2.27 trillion over that period.[xxxi]
The most important reason for the difference between the Galen study’s findings and the CMS analysis is that CMS uses state by state data, which are not publicly available. The Galen study relied on national data contained in the CMS 2016 Medicaid actuarial report.[xxxii]
This distinction accounts for the bulk of the difference between the Galen and CMS analyses. Although both agree that the AHCA caps would produce little savings when measured against the national average per capita spending, that average comprises allocation levels for 50 different states and the District of Columbia. Per capita spending in some states will exceed their per capita allocations in certain years, even when aggregate spending by all states is below the national average. Because the AHCA allocations are applied to each state, some will see reductions in federal matching payments as a result of exceeding their allocations.
The Galen study notes the importance of state-by-state data in its discussion of retrospective studies issued by the Kaiser Family Foundation and the Brookings Institute. One virtue of such studies, the Galen analysis notes, is that “they are useful in showing that changes in federal reimbursement policies have disparate impacts on states.” Because neither CBO nor CMS publishes estimated Medicaid spending on a state-by-state basis, the Galen study was limited to national averages and could not account for state-by-state differences.
CMS finds that the allocations “would have no impact on enrollment or eligibility and that states would be able to operate their programs under the caps through 2026” by making various adjustments to their programs.[xxxiii]
Conclusion
The CMS June 2017 analysis is broadly consistent with the findings of the Galen study. It corroborates the study’s chief finding that AHCA Medicaid savings forecast by both CBO and CMS are largely the product of enrollment forecasts by the respective agencies. CMS and the Galen studies also agree that the per capita allotments account for a much smaller portion of savings than do the projected changes in enrollment. The principal difference between the CMS and Galen analyses on the effect of the cap for the most part derives the CMS’s use of unpublished state-by-state baseline data. Even under the CMS estimate, the effect of the per capita allocations is relatively small, reducing federal Medicaid spending by less than 2.9 percent between 2020 and 2026.
[i] H.R. 1628, section 121. https://www.congress.gov/115/bills/hr1628/BILLS-115hr1628eh.pdf
[ii] Media reports often describe proposals to establish Medicaid per capita allocations in apocalyptic terms. See, for example, Sarah Kliff, “The American Health Care Act: The Obamacare Repeal Bill Just Passed, Explained,” Vox, May 4, 2017. https://www.vox.com/policy-and-politics/2017/5/3/15531494/american-health-care-act-explained See also, Michael Hiltzik, “All The Horrific Details of the GOP’s New Obamacare Repeal Bill: A Handy Guide,” Los Angeles Times, May 4, 2017. http://www.latimes.com/business/hiltzik/la-fi-hiltzik-obamacare-repeal-20170504-story.html
[iii] For further detail on the FMAP for expansion adults, see Table 2. This study uses 58 percent as the national average FMAP (excluding expansion adults), since that was the national average FMAP in 2012 and 2013, the years that immediately preceded the Medicaid expansion, according to CMS.
[iv] National Federation of Independent Businesses v. Sebelius, 567 US ___ (2012). https://www.oyez.org/cases/2011/11-393
[v] ”HR 1628: American Health Care Act,” Congressional Budget Office Cost Estimate, May 24, 2017, p. 17. https://www.cbo.gov/system/files/115th-congress-2017-2018/costestimate/hr1628aspassed.pdf
[vi] 2016 Actuarial Report on the Financial Outlook for Medicaid, Centers for Medicare and Medicaid Services, https://www.cms.gov/Research-Statistics-Data-and-Systems/Research/ActuarialStudies/Downloads/MedicaidReport2016.pdf
Because the 2016 Actuarial Report on Medicaid only provides estimates through 2025, figures for 2026 are extrapolated based on average annual growth between 2021-2025.
[vii] Medicaid Actuarial Report, Table 19, p. 62.
[viii] Medicaid Actuarial Report, Table 18, p. 61.
[ix] Medicaid Actuarial Report, Table 5, p. 15.
[x] Medicaid Actuarial Report, Table 16, p. 59.
[xi]To determine savings associated with the Medicaid enrollment reduction forecast by CBO, the CMS baseline per capita medical assistance payments for each year are multiplied by the number of people that CBO believes will not have Medicaid coverage due to AHCA. That number, in turn, is multiplied by the federal share of that medical assistance to determine federal Medicaid savings. Calculation of direct savings attributable to normalization of the FMAP involves an estimate of the number of expansion adults for whom the state would claim a 90 percent match (i.e., those who enroll prior to January 1, 2020). An FMAP of 58 percent is assumed for the rest. [See footnote 17 for further details on how the number of recipients in each FMAP category is estimated.] That number is then compared with the CMS per capita baseline estimate with a 90 percent FMAP. CMS’s per capita medical assistance payments in 2016 for each category of recipients is used as the basis for determining per capita allotments under AHCA. Those sums are then indexed for medical inflation, as directed by AHCA. The AHCA per capita amounts are then compared for each of the years 2020 through 2026 with the CMS baseline per capita estimates. If the CMS baseline estimate for any year exceeds the AHCA caps, that figure is multiplied by the CMS estimate number of recipients for that year, less any enrollment reduction forecast by CBO. That figure is then multiplied by the weighted average FMAP to determine the federal savings under the caps for that fiscal year.
[xii] “American Health Care Act,” Congressional Budget Office Cost Estimate, March 13, 2017, p. 9. https://www.cbo.gov/system/files/115th-congress-2017-2018/costestimate/americanhealthcareact.pdf
[xiii] CBO, March 13, 2017, p. 9.
[xiv] CBO, March 13, 2017, p. 9.
[xv] CBO, May 24, 2017, Table 4.
[xvi] CBO, May 24, 2017, p. 9.
[xvii] The estimates used in this paper begin with the CMS forecast that 12.5 million people would be enrolled in Medicaid in 2019. It assumes that 2/3 would remain on the rolls in 2020, 1/3 in 2021, 15 percent in 2022, 10 percent in 2023, 5 percent in 2024 and 0 percent in 2025 and 2026. These numbers are then multiplied by the average per capita spending for the expansion population, as projected by CMS, and then by 0.9, the federal FMAP for those who enroll prior to 2020. The remainder of the expansion population is assigned an FMAP of 0.58, the average federal matching percentage for 2012 and 2013, the last years before Medicaid expansion.
[xviii] H.R. 1628, section 121. https://www.congress.gov/115/bills/hr1628/BILLS-115hr1628eh.pdf
[xix] Although CBO has not disclosed its estimate of savings related to AHCA’s per capita allocations, it is reasonable to infer that they view them as having a greater effect. In March 2017, CBO estimated that an earlier version of AHCA would save $880 billion. The House subsequently modified the per capita allocation provisions to increase the allotments for people with disabilities and the elderly. CBO estimated that the later version of AHCA, which the House passed, would save $834 billion, BILLION, $46 billion less than its March estimate. Some or all of this difference may be due to the increase in the per capita allocations. Interestingly, CBO concluded that this additional $46 billion in Medicaid spending would not increase the number of Medicaid recipients.
[xx] CBO, March 13, 2017, p. 10.
[xxi] For a discussion of how CBO might make its operations more transparent, see Yuval Levin, “The Congressional Budget Office Needs To Be Reformed,” National Review, June 2, 2017. http://www.nationalreview.com/article/448227/congressional-budget-office-scoring-methods-obamacare-american-health-care-act
[xxii] Avik Roy has similarly noted that projected medical inflation is fairly close to baseline assumptions about Medicaid per capita spending growth. See Avik Roy, “How Much Will the GOP’s Medicaid Per Capita Cap Proposal Save, If Anything? CBO Refuses to Say,” Forbes, The Apothecary, June 8, 2017. https://www.forbes.com/sites/theapothecary/2017/06/08/how-much-will-the-gops-medicaid-per-capita-cap-save-if-anything-cbo-refuses-to-say/#d0190c96376e
[xxiii] Rachel Garfield, Rudy Rudowitz and Katherine Young, “Data Note: What If Per Enrollee Medicaid Spending Growth Had Been Limited to CPI-M from 2001-2011?” Kaiser Family Foundation Issue Brief, March 2017. http://www.kff.org/medicaid/issue-brief/data-note-what-if-per-enrollee-medicaid-spending-growth-had-been-limited-to-cpi-m-from-2001-2011/
[xxiv] Loren Adler, Matthew Fiedler, Tim Groninger, “Effects of the Medicaid Per Capita Cap Included in the House-Passed American Health Care Act,” Brookings Institution, Center for Health Policy, May 2017. https://www.brookings.edu/research/effects-of-the-medicaid-per-capita-cap-included-in-the-house-passed-american-health-care-act/
[xxv] John Holohan, Matthew Buettgens, Clare Pan and Linda J. Blumberg, “The Impact of Per Capita Caps on Federal and State Medicaid Spending,” Urban Institute, March 2017. http://www.rwjf.org/content/dam/farm/reports/issue_briefs/2017/rwjf436077
[xxvi] For a critique of CBO’s assumptions in its analysis of AHCA, see Doug Badger, “The CBO Bludgeon,” Galen Institute, May 2017. https://galen.org/the-cbo-bludgeon/
[xxvii] Paul Spitalnic, CMS Chief Actuary, “Estimated Financial Effect of the ‘American Health Care Act of 2017,’” Memorandum from the Office of the CMS Actuary, June 13, 2017.
[xxviii] Spitalnic, “Estimated Financial Effect of AHCA,” p. 10.
[xxix] Spitalnic, “Estimated Financial Effect of AHCA,” p. 10.
[xxx] Spitalnic, “Estimated Financial Effect of AHCA,” Exhibit 3, p. 9.
[xxxi] CMS reports its estimated federal Medicaid spending baseline in Spitalnic, “Estimated Financial Effect of AHCA,” Appendix C, p. 30.
[xxxii] CMS also increased its estimated per capita spending for each eligibility category since publication of its actuarial report. In particular, it has increased its estimated per capita costs incurred by expansion adults. These higher spending levels also account for a small portion of the differences between CMS’s analysis of AHCA and the Galen study. CMS also forecasts a dramatic reduction in the number of expansion adults – from a baseline estimate of 13.6 million in 2026 to just 1.8 million under AHCA. This reduction is offset somewhat by CMS’s assumption that the number of recipients in all other eligibility categories will increase by 3.8 million in 2026, resulting in a net reduction of 8.0 million recipients in that year. These elements of the CMS forecast also account for some differences with the Galen study findings.
[xxxiii] Spitalnic, “Estimated Financial Effect of AHCA,” p. 24. These adjustments would include “managing utilization and program efficiency,” as well as reducing optional services and payments to providers. CMS also notes that it “may be more difficult for States to operate their Medicaid programs without making more significant changes to their programs” at some point after 2026. Congress, of course, could modify the caps before that time if states were to confront such an eventuality.